What is Thermal Mapping?
Temperature Mapping is performed to determine if a storage area can maintain temperature within defined limits (Fridges, Freezers, Ovens, Rooms, Warehouses and Incubators etc.). Sensors are distributed throughout the unit/room in pre-defined locations to confirm it performs within pre-defined set points.
- Mapping & Process Validation Activities by Nityaa Associates:
- We are having a Universal Data Logger System along with corresponding Sensors/ Transmitters to perform Mapping Activities at a consistent level. The Universal Data Logger is offering maximum Sampling Interval upto 10mSec. The personnel are having the knowledge and experience to help the customer’s access and define their compliance and validation requirements. With the use of Traceable Master Data Logger & Sensors, Process Validation is performed in order to report System’s status with proper Documentation.
- We serves Mapping Activities at following fields:
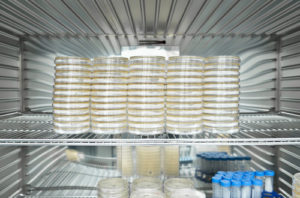
- Quality Control Equipment like Ovens, BODs, Incubators, Stability Chambers, Environmental Chambers, Water Baths, Deep Freezers, etc.
- Temperature and / or Rh Mapping of Cold Rooms, Warehouse, Control Sample Rooms, Clean Areas, etc.
- Mapping of Steam, Dry Heat & EO Sterilizers, High Temperature Furnaces, etc.
What set point should we use?
Storage area is further challenged with additional tests such as empty mapping, loaded mapping, door open, power failure, pull down tests, fan failure etc. which are all performed to demonstrate the unit controls within pre-defined parameters and to determine the position of permanent monitoring/alarm probes.
These temperature set-points are used as an initial guide, however if temperature mapping demonstrates a more suitable set-point for the range then the set point can be adjusted (e.g. 31.9°C instead of 32.5°C may provide a more uniform temperature within the specified limits due to the location of the control probe).
What tests should we perform during Temperature Mapping?
For temperature controlled units such as fridges, freezers and incubators, the testing required should be identified during risk assessment. Examples of common tests performed include:
- Temperature Distribution Test (Empty)
- Temperature Distribution Test (Loaded)
- Door Open Test
- Power Off Test
Additional tests that may be performed if required for the product or process:
- Temperature Distribution (Partial Load)
- Temperature Penetration Test (Loaded)
- Pull Down Test
For some storage environments, for example warehouses, it may not be possible to perform some of the testing for example an empty distribution map, power off or door open. There may also be additional testing requirements specifically for that environment which could include:
- Compressor Switch over Tests
- Compressor Failure Tests
How long should we map for?
The duration of temperature map should show the stability of the unit and identify any routine changes within the use for example a defrost cycle. Your site may already have a Validation Master Plan (VMP) or procedure with the mapping durations detailed. The table below shows some typical examples for temperature mapping durations:
For warehouses it is important to consider the movement of people, fans, doors opening and closing, seasonal variations. It is important to consider the impact of these variations including changes in shift patterns or the week and weekend. It is also important to understand the temperature distribution during seasonal variations by performing winter and summer maps.
How many sensors should we use for temperature mapping?
The number of sensors required really depends on the type of unit being tested and what it will be used for. Some common examples of number of sensors can be found below:
Fridges, Freezers and Incubators (Temperature Controlled Units)
- Under bench Units-9 Sensors
- Upright Units-12 Sensors
Cold Stores – Based on a risk assessment which would consider:
- Unit Size
- Fan Location
- Vent Location
- Racking/Shelving
Warehouse – Based on a risk assessment which would consider:
- Size of warehouse
- Fan Locations
- Heater Locations
- Air Conditioning units
- Windows/Skylights
- Racking and Shelving
- Internal and external doors
Where should we place our sensors?
Sensors should be distributed throughout the storage area to get a detailed understanding of the performance of the unit. To identify cold/hot spots within the unit/area and determine locations for the permanent monitoring probe/s.
If this is a requalification exercise a sensor should be placed ajacent to the monitoring/alarm probe/s. This is to ensure that this location is the most suitable for the monitoring probe i.e. the Highest or Lowest temperature within the unit.
A common mistake is to place the monitoring probe in the location closest to the averarge temperature within the unit. This is the location least likely to fail, this would mean that any fault with the system is unlikely to be detected unit the next requalification exercise.
We recommend that two moitoring/alarm probes are placed with a temperature controlled unit. These probes should be located in the minimum and the maximum temperature locations identified during the temperature map. This will help identify any faults with high and low temperatures on the unit.
Monitoring probes maybe placed in suitable buffers (Glycol, aluminum block etc) or with alarm delays to prevent regular alarms caused by routine use (door opening etc.)
Highly Accurate Data Loggers!
We at Nityaa Associates use highly accurate and calibrated data logger devices, which are traceable to national standards!
- Accuracy
- This can vary between ±2°C to around ±0.05°C and is dependent on use.
- Equipment at Thermal Compliance, accuracy range varies from ±0.05°C to ±0.5°C depending on application.
- Response Time
- This will impact the data received, probes with slow response times will artificially buffer fluctuating data.
- Note: Response Time is very important for sterilisation processes and EN285:2015 requires the sensors Response Time (T-90) to be ≤5 Seconds. We anticipate this will become more prevalent in other sterilisation standards.
- Internal /External Sensor
- Internal Sensors create an air buffer and this has an impact on the data measured. Essentially they may not record the highest and lowest temperatures.
- External Sensors are in free space and this can aid the placement of the sensor. They can also be used for product penetration tests.
- Materials of Construction
- Stainless Steel (For Cleanrooms)
- Consider if the logger is to be used in an ATEX Area
- Logging frequency
- Memory Size
- How many logs/data points can you record, this should be suitable for the duration and log interval of your temperature mapping exercises. If you are logging at 1 minute intervals for 24hours this would be 1440 data points. If however you were logging at 2 second intervals for a 24hour mapping exercise you would need 43,000 data points.
- Range
- Consider your site requirements, do you need to temperature map an Ultra Low -80°C Freezer, if you do then you will require a sensor that can record and has been calibrated below the temperature range for example -90°C.
- Are you going to use the same loggers for high temperature processes? If so then you would need to ensure the logger is suitable for use at these temperatures.
- Calibration
- Can the logger be calibrated and is it possible to apply offsets?
- Software
- Ensure the software is 21 CFR Part 11 Compliant
- Can the software meet your URS and your Installation Qualification (IQ) and Operational Qualification (OQ)
- Is the software flexible enough to apply calculations and process complex data?
- Can the software compile all data loggers to one graph to provide clear graphical data